|
Freezes, crashes and slow response times…these are just some of the nightmares of each and every businessperson who have plunged into app development. According to Localytics data, 23% of users launch an app only once. Can in-app performance lead to app removal? Here are basic app performance metrics to help you stop mobile app churn dead in its tracks.
App performance metrics overview
App performance metrics help to timely diagnose performance-related issues to maintain an expected level of service and better end-user experience. Surely, when dealing with a professional software development firm, profound app testing is always carried out during the whole process of app development and further on. Nevertheless, knowing app performance KPIs (key performance indicators) will allow for catching any problem before it manifests or right away if it does. 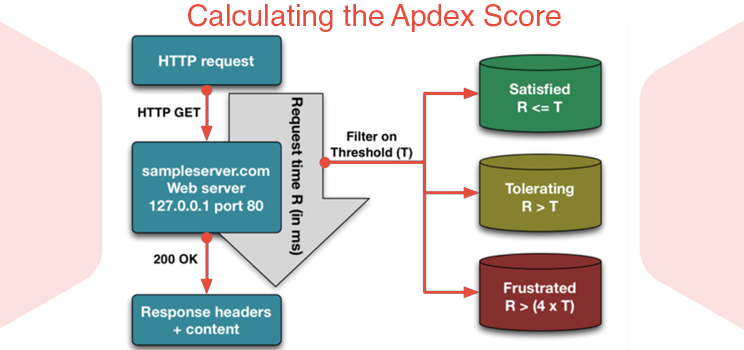
Apdex score or application performance index
These metrics give app owners a better insight into the level of user satisfaction with the response time of the product by measuring the ratio of satisfactory response times to unsatisfactory ones [1]. How does it work? You define a response time threshold or set an ideal to measure customer happiness and satisfaction with your product. That’s where such levels as satisfied, tolerated and frustrated (threshold times 4) come from. Here’s a formula for you to measure, Apdex = Satisfied requests + (tolerating requests / 2) Total number of requests For example, with 150 server requests within a 2 minute period, the threshold amounts to 0.5 seconds (an arbitrary value). 110 requests were handled within 0.5 seconds and therefore classified as satisfied. 25 requests were handled within 0.5 and 2 seconds and classified as tolerated. The remaining 15 requests took longer than 2 secs and are classified as frustrated. The Apex score amounts to (110 + 25/2)/150 = 0.8. While being a numerical measure of user satisfaction with your app’s performance, a uniform scale of 0-to-1 (with 0 meaning that no user is satisfied and 1 showing that all users are satisfied) is a “standard to reflect the experience of the end-user for everyday applications” [2]. Request Rate Knowing the number of received traffic will definitely affect the success of the product as most of other application performance metrics are influenced by traffic increases and decreases. It allows for tracking spikes, inactivity as well as dynamics of how your app scales. 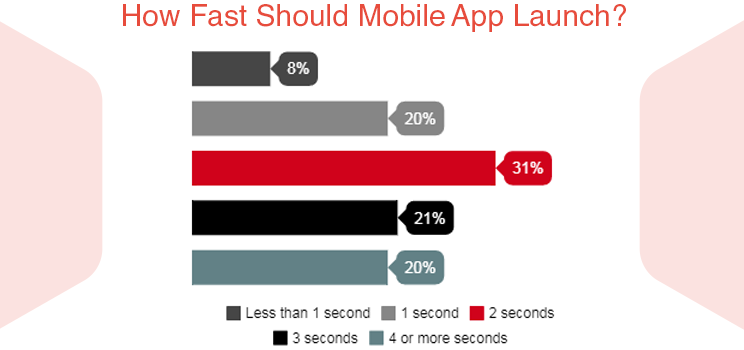
App Load Time
How long does it take to load an app? No matter how catchy your app has been designed, if it takes more than 2 or 3 seconds to load, your product is very close to be abandoned. According to Dynatrace survey report, an average expected app load time amounts to 2 secs. Moreover, 50% of users are mainly frustrated by app load time, while 46% of iOS apps and 53% of Android ones take more than 2 seconds to load. Resource consumption rate According to the online study that was carried out by uSamp, freezing (76%), crashing (71%) and slow responsiveness (59%) were the main issues of apps with heavy battery usage (55%) and too many ads (53%). Memory consumption is also a matter of high concern as mobile devices have limited memory capabilities so far. Therefore, it is a must to think over design and development elaborately or deal with an experienced vendor to hold on the necessary parameters in check (please, have a look at some of the solutions we offer at r-stylelab.com). The following parameters must be carefully monitored:
App crash rate With a plethora of constantly competing apps on the app stores to choose from, any repeating and/or abrupt shutdowns of your product won’t play into your hands. This rate directly affects user experience and rating of an app. In fact, best apps have crash rates less than 0.25%, while all apps across iOS and Android platforms fail to meet this standard, according to Apptelligent. In order to perform troubleshooting to the fullest extent, it’s essential to find out:
App Speed The speed of an app is basically determined by the number of requests to the back-end servers. The higher the number of such requests, the higher the chances of app slowing down or crashing. The speed of app response time is affected by HTTP calls, data size, quality of the network connection, API requests, just to name a few. Tools to track app performance metrics There are multiple tools in the market to help you track app performance metrics not to lag behind. For example, Logentries helps tracking errors, performance and usage. With a 7-day free trial, the price for its services ranges from $ 39 to $ 265 depending on how many GB you send up a month (from 30 to 150 GB). New Relic also provides services of the kind for $ 999 per month with unlimited data retention. Dynatrace gives full insights into app performance starting from $0.035 per host / hour. Therefore, with a strong desire to track your app’s performance, there is an abundance of services to choose from and complement your requirements. Final takeaways With all that said, it won’t hurt to know that:
0 Comments
Your comment will be posted after it is approved.
Leave a Reply. |
