
Merely 0.01% of consumer mobile apps will be deemed to be successful financially in 2018, says Gartner. Tracking the Key Performance Indicators (KPI) allows for being among the lucky few. Here’s a profound overview of user retention rate as one of the metrics to solve user engagement obstacles.
User Retention
These metrics let you know how many users (in percentage terms) have opened the app in a more recent or distant timeframe after it had been installed. In other words, retention is users’ returning to the app at least once within 30-day timeframe. After the install, users evaluate whether they like your app or not. At the worst-case scenario, they’ll use it once and ditch it for good in a heartbeat. However, if the app has taken users’ fancy, it’ll be reopened and is likely to be used again. To size up the level of user engagement, the following metrics are used the most frequently: 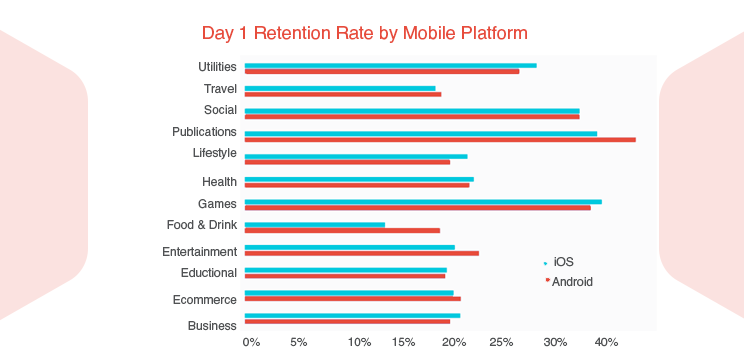
Day 1 retention
These metrics show the percentage of users that opened your app the next day after it had been installed. It effectively shows the number of users with an outstanding interest in your product as they’ve decided to get back to it ASAP. The low rated value of these metrics indicates that users are not fully satisfied with your product. What can low day 1 retention rate indicate? Your product is likely to have certain interface issues. It might be clumsy and/or weird. This is the first thing to give thought to as the chances that a user gets back to your product after showing no interest to it the next day after the install significantly dwindle. In fact, an average app loses 77% of its users within three days after it has been installed, according to Andrew Chen, Silicon Valley Analyst [1]. Do you feel the need to know how your app is doing? Here’s a formula to calculate: 1DR = X1/Z, where X1 is the number of users that retained to the app the next day after it had been installed; Z is the total number of users that installed the app on Day 0. For example, you’ve released an app on Monday and it had 200 new users the very same day. On Tuesday only 70 users out of these 200 returned to use the app once again. Then day 1 retention equals 70/200 = 0.35 or 35%. In fact, 50% value would be a great percentage for these metrics, while some apps manage to tread water when their Day 1 retention rate amounts to 20-30% [2]. Anyways, top apps tend to have higher Day 1 retention rates. Besides measuring customer retention, these metrics might be also of much use in case of launching a one day user acquisition campaign. The data received will show the level of stickiness of those new users to your product and the effectiveness of the campaign itself. 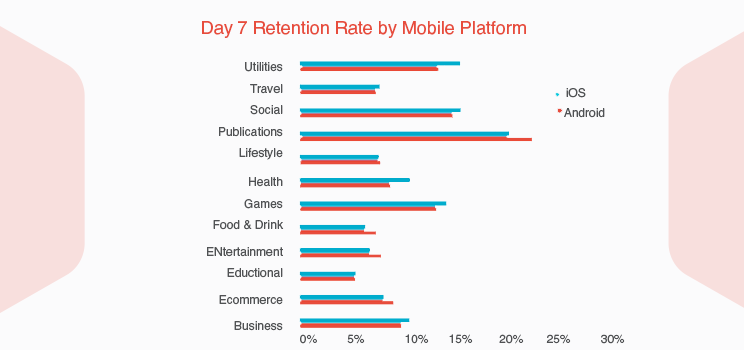
Day 7 retention
These metrics show the percentage of users that returned to your app a week after it had been installed. If these metrics are lower than the ones of Day 1, then a more profound analysis must be carried out. This will help to figure out what pushes users away after they’ve been using a product for a week already. Here’s a formula for you to calculate: 7DR = X7/Z, where X7 is the number of users that retained to the app on the seventh day after it had been installed; Z is the total number of users that downloaded the app on Day 0. For example, on Monday your app had 200 users. Next Monday, i.e. a week later, only 30 users out of these 200 returned to use the product once again. Then day 7 retention equals 30/200 = 0.15 or 15%. It has been said that users decide to keep on using an app or not within first 3-7 days after the install no matter whether these are iOS or android apps. The path to success is managing to hook users within that critical period [3]. In fact, after a week of install overall app retention drops to about 11%, while mobile games have the highest average day 7 retention rate, which amounts to 20% [4]. These numbers are an average and they are a good benchmark to target. 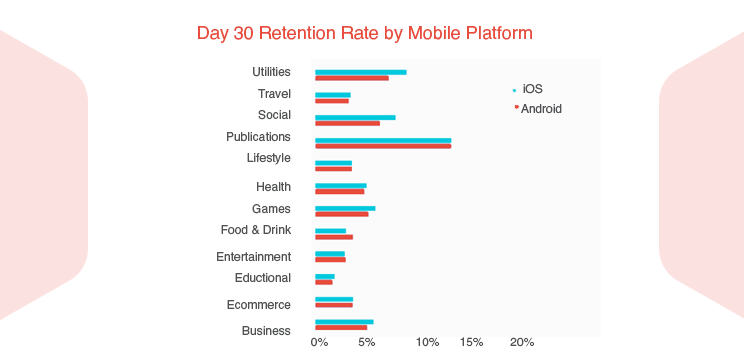
Day 30 retention These metrics show the percentage of users that opened an app on the 30th day after it had been installed. A loss in value for these metrics, when compared to day 7 retention rate, shows that your product has profound strategic and hidden drawbacks. Here’s a formula for you to calculate: 30DR = X30/Z, where X30 is the number of users that retained to the app on the thirtieth day after it had been installed; Z is the total number of users that downloaded the app on Day 0. For example, 20 users out of 200 return to your app a month after the first Monday they’ve installed the product. Then day 30 retention rate equals 20/200 = 0.1 or 10%. What this customer retention measurement may tell you about? A low Day 30 retention rate with high session per user, for instance, might indicate that your product is quite catchy and can grab users’ attention though it has troubles keeping users after a month of use. While these metrics might be a landmark in your app’s history (as 90% of users eventually stop using an app after a month [1]), make sure to deal with professional software development companies to tailor solutions that users can’t literally take their eyes off! Moreover, it’s significant to keep in mind that these three metrics should be evaluated on a daily basis. A chosen date is to be compared to the installation date. Analysis of these metrics’ dynamic pattern will allow for understanding your users’ reaction to any changes made to the app. Conclusion Your mobile app users are a lifeblood of your business. Therefore, knowing the quantity of customers you have is crucial both on the release stage and further on. Monitoring these metrics when running advertising campaigns, posting app reviews and making partner agreements, for instance, will at least show you the efficiency level of the performed actions and allow for taking whatever measures are necessary to hit the target!
[1]http://www.androidauthority.com/77-percent-users-dont-use-an-app-after-three-days-678107/
[2]http://www.pocketgamer.biz/comment-and-opinion/60092/why-day-7-retention-is-just-as-important-as-day-1/ [3]http://andrewchen.co/new-data-shows-why-losing-80-of-your-mobile-users-is-normal-and-that-the-best-apps-do-much-better/ [4]https://arc.applause.com/2016/05/20/app-retention-rates-2016/
0 Comments
Your comment will be posted after it is approved.
Leave a Reply. |
